Timing
Sandwich has a built-in notion of test timing. Timing can be useful when you have a large test suite and want to understand where it is spending the most time.
The goal of the timing system is to create a nice summary report, ideally in the form of a flame graph.
You can select a test timer implementation you use in the Sandwich options. The default one targets SpeedScope, a nice web-based tool for visualizing flame graphs.
Non-concurrent
The simplest use of timing occurs when we don't have any parallel stuff going on, so the tests all run in a single thread. To deal with multiple threads, see the concurrency section.
First of all, every node in the test tree is timed by default. Thus, the "describe" and "it" nodes in the example below will be timed automatically. You can prevent this by changing the node options.
In addition, you can time arbitrary blocks of code using the timeAction function. This function is a bracket_ style combinator that can be used to wrap an action. In the example below, we use it to wrap some sub-steps within a test.
timingDemo :: TopSpec
timingDemo = describe "Dinner tests" $ do
  it "Makes dinner" $ do
    pauseSeconds 1
    timeAction "Makes pasta" $ do
      timeAction "Heats water" $ pauseSeconds 1
      timeAction "Boils noodles" $ pauseSeconds 0.8
      timeAction "Decants noodles" $ pauseSeconds 0.7

  it "Cleans up" $ do
    pauseSeconds 1
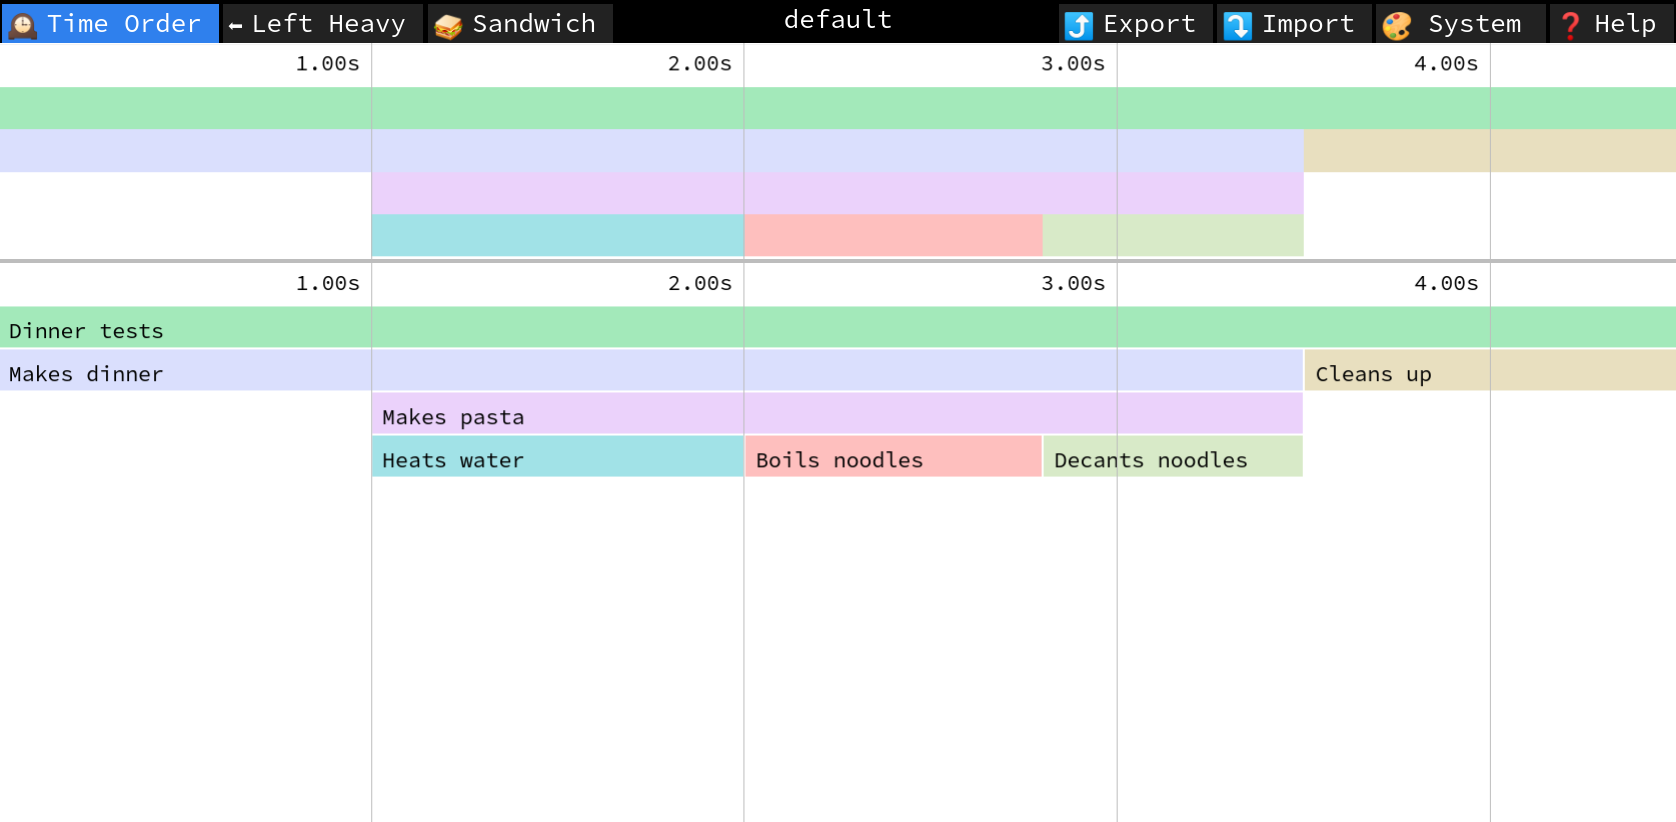
When you run this code using the default implementation, it will output a file speedscope.json in the root of the test results. If you drag and drop this file onto SpeedScope, you get a picture like the following. Note that the profile (in the center of the top bar) is "default." In the next section we'll explore using multiple threads (and thus multiple profiles).
Dealing with concurrency
Flame graphs need to be properly nested to be valid. If Frame A starts before Frame B, then Frame B must end before Frame A ends. When you run test subtrees in parallel, it's easy to violate this property and get stack frames that cross over each other. This will result in a malformed JSON file that makes the visualizer unhappy.
The solution is to introduce "profiles" within the test timer to correspond to execution threads, and make sure you run in a single-threaded way within each profile. Below is a simple example of this in action. Note that we use the parallel keyword at the top level, to cause the two test trees underneath it to run in their own threads. Immediately underneath the parallel keyword, we use withTimingProfile to switch the profile for the rest of the sub-tree.
timingParallelDemo :: TopSpec
timingParallelDemo = parallel $ do
  withTimingProfile "italian" $
    it "Makes Italian dinner" $ do
      pauseSeconds 1
      timeAction "Makes pasta" $ do
        timeAction "Heats water" $ pauseSeconds 1
        timeAction "Boils noodles" $ pauseSeconds 0.8
        timeAction "Decants noodles" $ pauseSeconds 0.7

  withTimingProfile "chinese" $
    it "Makes Chinese dinner" $ do
      pauseSeconds 0.1
      timeAction "Makes rice" $ do
        timeAction "Cooks rice" $ pauseSeconds 0.5
        timeAction "Serves rice" $ pauseSeconds 0.2
      pauseSeconds 0.3
Advanced configuration
You can configure some settings for the test timer as part of the normal Options object. To disable the test timer entirely, just switch to the NullTestTimer:
myOptions = defaultOptions { optionsTestTimerType = NullTestTimerType }
Every test timer implementation has some implementation-specific options. For example, you can pass an arg with SpeedScopeTestTimerType to cause it to emit a raw timing data file in addition to the JSON file. This is a simple event-based format with one timing event per line, and it can be useful to debug parallelism issues or convert to another format.
If you'd like to support another timing format or visualizer, please open a PR! It should be easy to add more.