Terminal UI Formatter
The terminal UI formatter is one of the key features of Sandwich. It uses the awesome Brick library to make an interactive UI for running (or re-running! ) tests and inspecting their results.
Usage
If you're using runSandwichWithCommandLineArgs, you can simply pass --tui and the terminal UI formatter will be selected.
If you're using the lower-level runSandwich, simply include the formatter in the optionsFormatters of your sandwich options.
import Test.Sandwich.Formatters.TerminalUI

main :: IO ()
main = runSandwich options myTests
  where
    options = defaultOptions {
      optionsFormatters = [SomeFormatter defaultTerminalUIFormatter]
      }
About the UI
Most of the hotkeys are documented at the top of the UI and should be self-explanatory. The UI shows the state of the entire test tree, with each entry color-coded by its status (not started, pending, running, failed, or succeeded). You can use the arrow keys to scroll up and down through the focused nodes.
Each node of the test tree can be opened/closed by pressing enter or tab. Opening a node shows details about what happened when it was executed. In the picture below, the "adding one" node is opened, allowing the test failure to be examined.
Once a node is open, its contents can be scrolled up and down by pressing Control-v/Meta-v. This allows you to page through failure results and logs.
Each node can also be folded/unfolded by pressing the left and right arrows. This is like folding a tree in your file manager; if a node is folded then its children will be hidden.
The tree is pruned by visibility threshold. If you press the v button, it will cycle through different thresholds so you can show or hide the "less important" nodes.
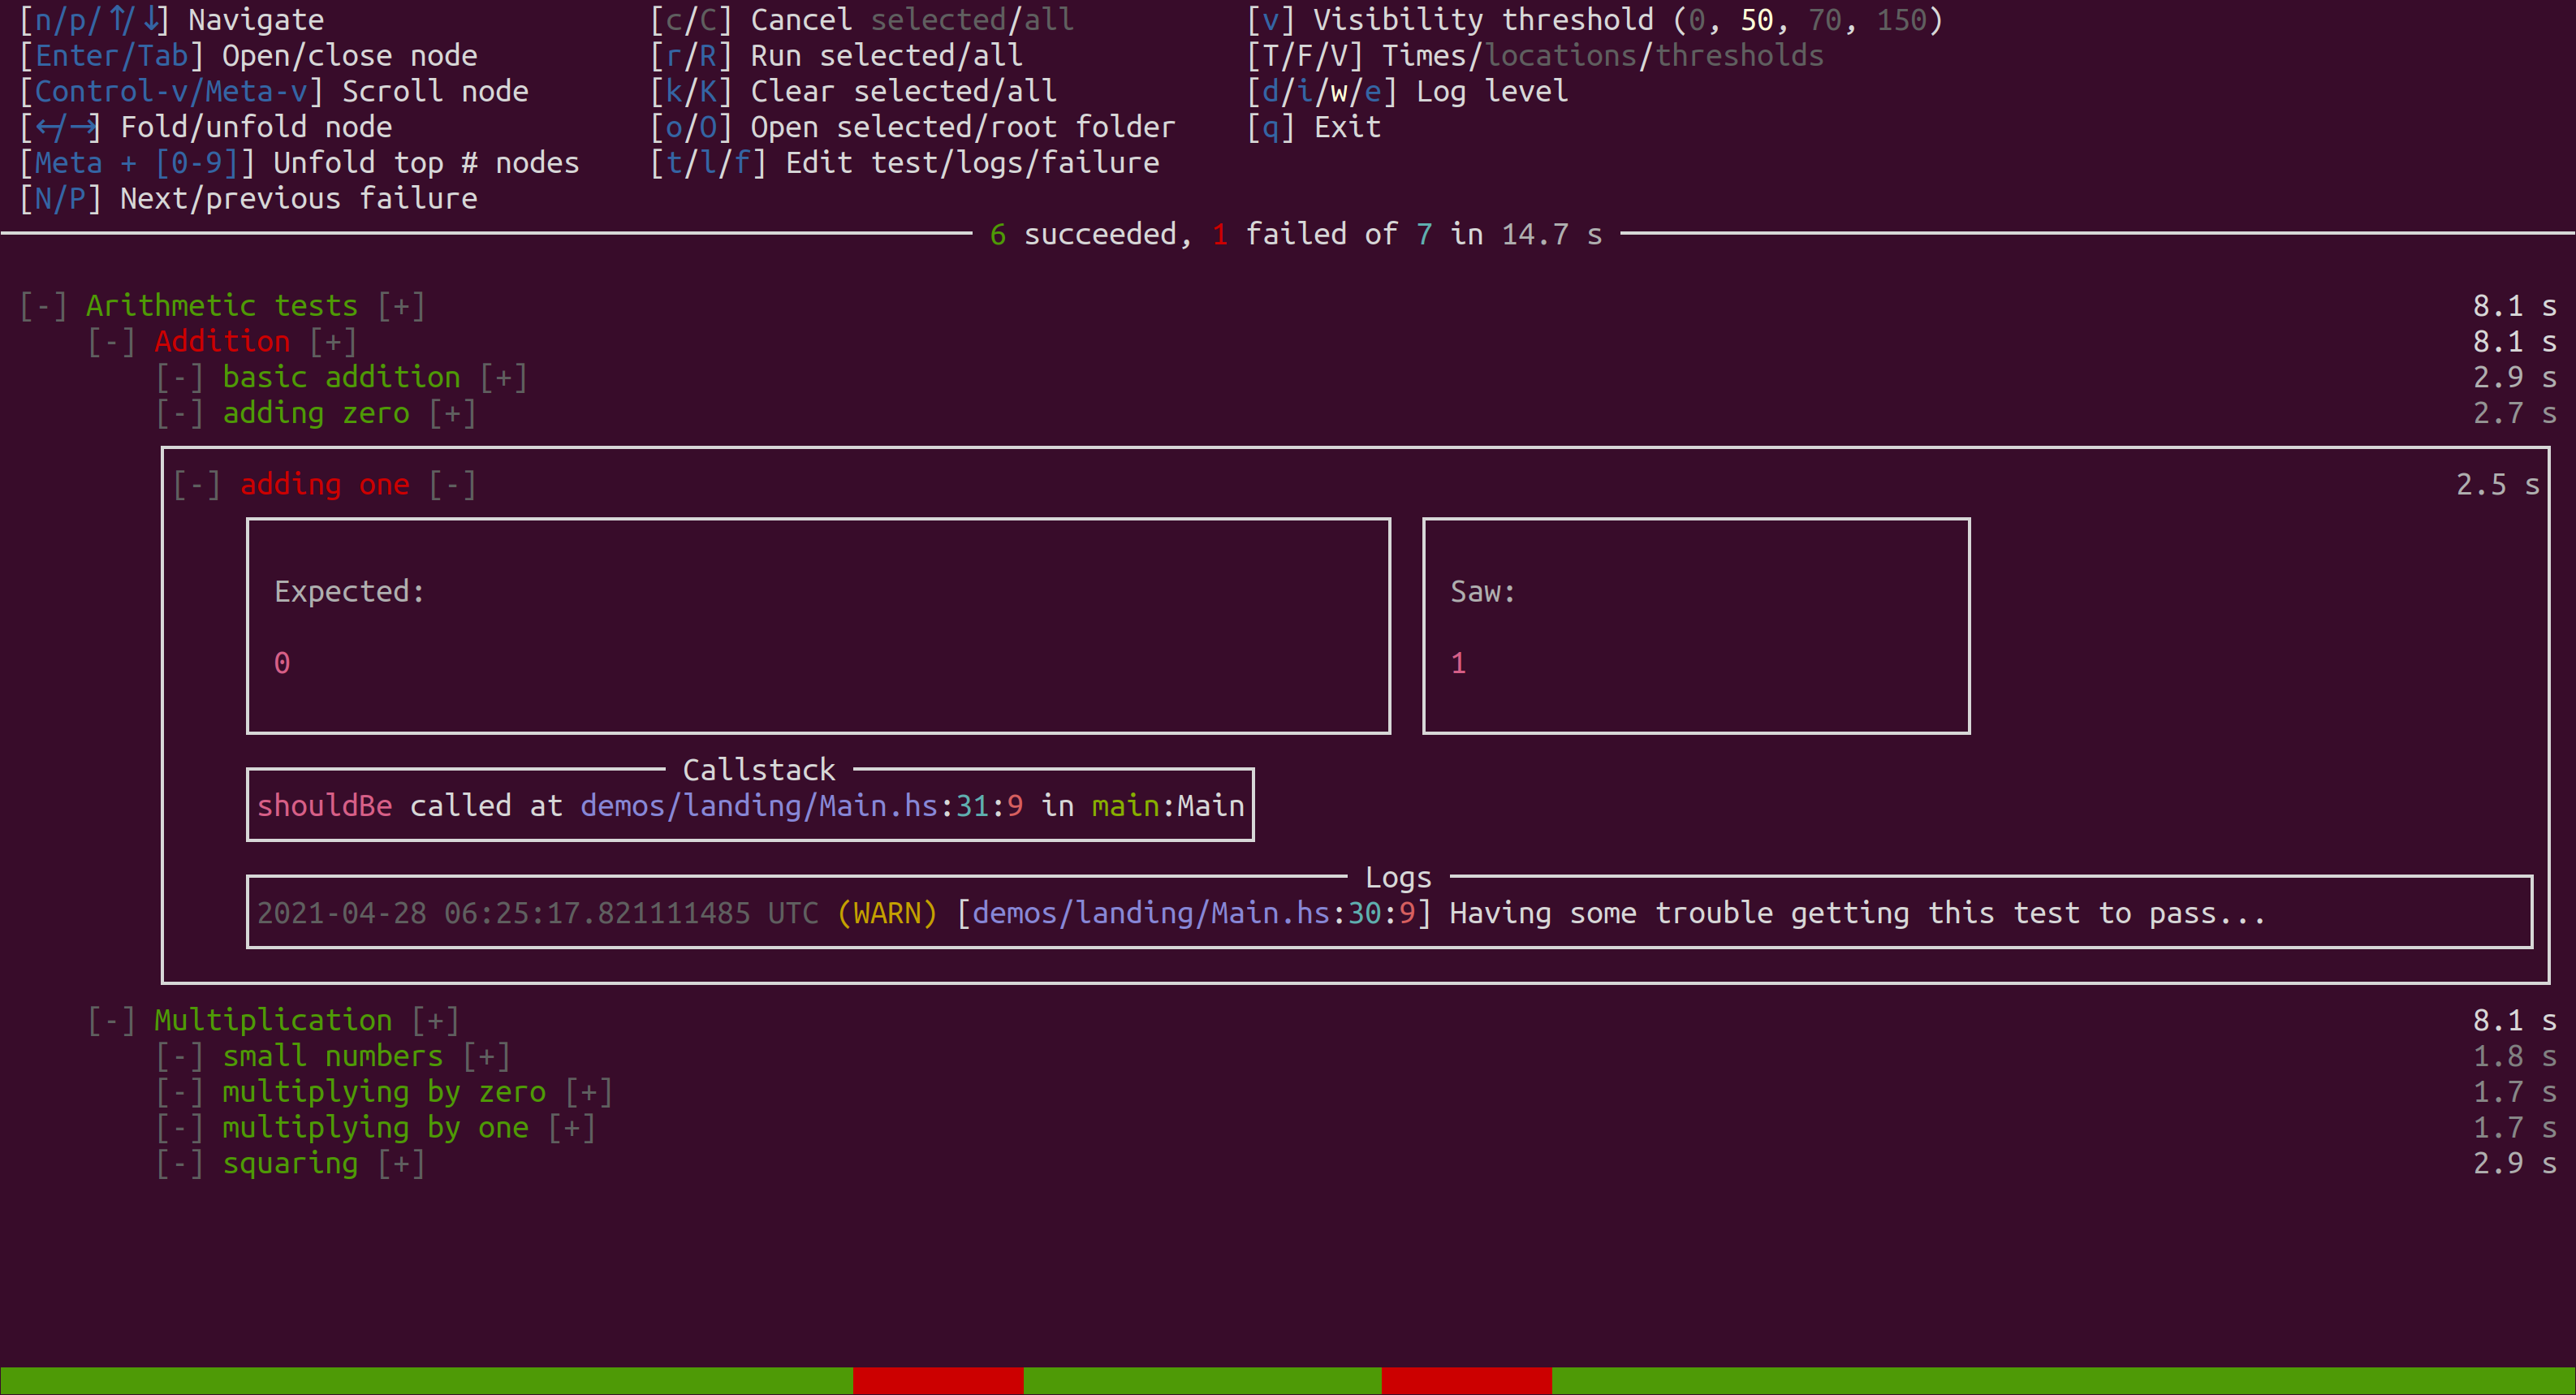
One less-obvious cool feature is that the colored bar at the bottom can be clicked. If you see a red patch and click on it, the UI will jump to the failure(s) corresponding to that point in the tree.
Opening nodes in your file explorer
Pressing the o key will open the currently focused node's folder in your file explorer. Pressing O will open the test tree's root folder.
Jumping to tests, logs, and failures in your editor
If you configure your editor in the EDITOR environment variable, the UI can jump directly to the test, logs, or failure location corresponding to the focused node. There are a couple tricks to set this up.
When invoking the EDITOR command, the strings FILE, LINE, and COLUMN will be replaced with the desired file, line number, and column number respectively. This helps you write custom commands to jump directly to the right location. If the EDITOR command doesn't contain the string "FILE", the filename will be appended to the end of the command.
Thus, you could do
export EDITOR="vim +LINE"export EDITOR="vim +LINE FILE"(same as previous)export EDITOR="emacs -nw --eval '(progn (find-file FILE) (goto-line LINE) (forward-char (- COLUMN 1)) (recenter))'"- This one recenters the view after jumping to the given location. You can put arbitrary Emacs Lisp here.
export EDITOR="code -g FILE:LINE:COLUMN"(For VSCode)
Configuration
Several aspects of the UI can be configured in your test code when you introduce the formatter. For example, you can set the initial value of the visibility threshold or settings like terminalUIShowRunTimes.
You can also set a default value to use for the EDITOR command if the variable is not set. If you want even more control over opening editors, you can provide a custom callback which will be used instead of the default to open them.
Custom exception formatters
If your tests throw custom exceptions, you can control the way they are formatted. To do this, simply pass a list of callbacks to the terminalUICustomExceptionFormatters argument of the Terminal UI Formatter settings. The callback can match against a SomeException and optionally return a CustomTUIException. This return type has two constructors. One allows you to boil your exception down to a simple message and callstack to display. The other is more powerful and allows you to display the exception as an arbitrary Brick widget.
Below is an example of passing a callback that matches a custom exception and displays it using blue text. You can find a full working example in the custom-exceptions demo.
data MyColoredException = MyColoredException Text
  deriving Show
instance Exception MyColoredException

formatMyColoredException :: SomeException -> Maybe CustomTUIException
formatMyColoredException e = case fromException e of
  Just (MyColoredException msg) -> Just $ CustomTUIExceptionBrick $ modifyDefAttr (\x ->
    x { attrForeColor = SetTo blue }) (str $ T.unpack msg)
  Nothing -> Nothing

customExceptionsDemo :: TopSpec
customExceptionsDemo = describe "Custom exceptions" $ do
  it "formats a custom exception with its own widget rendering function" $ do
    liftIO $ throwIO $ MyColoredException "My widget message"

testOptions = defaultOptions {
  ...
  , optionsFormatters = [SomeFormatter $ defaultTerminalUIFormatter {
      terminalUICustomExceptionFormatters = [formatMyColoredException]
      }]
  }